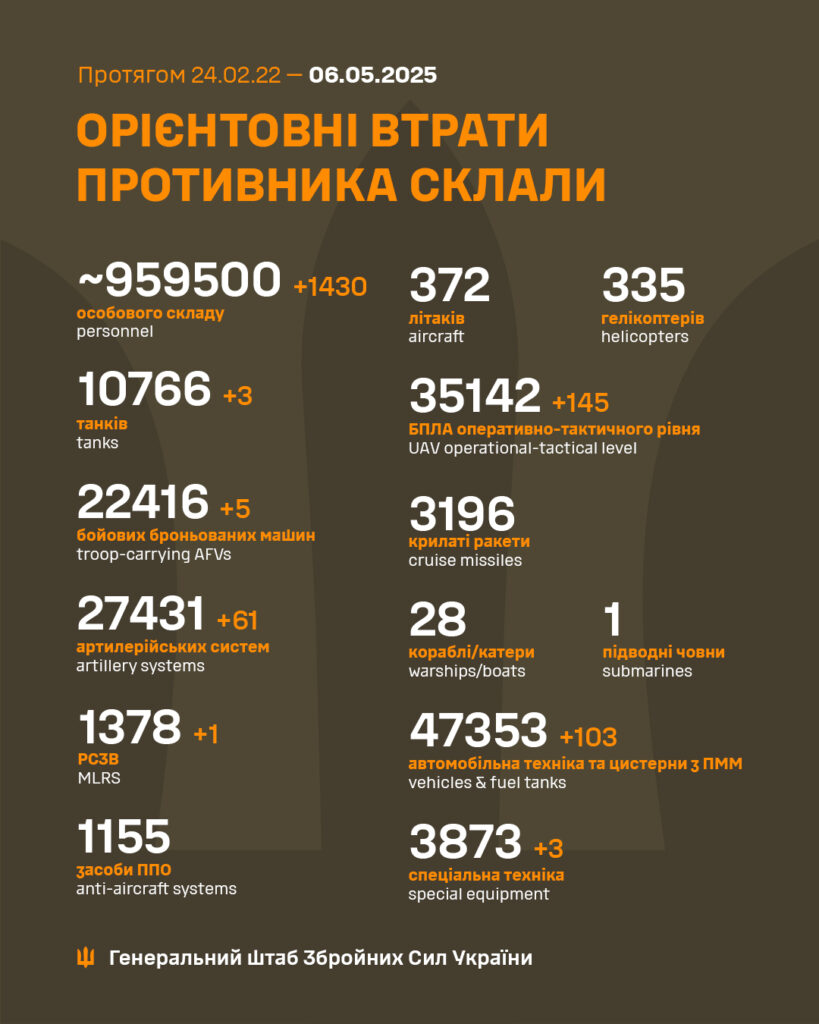
Russian losses in Ukraine 2025-05-06
- 1430 KWIA
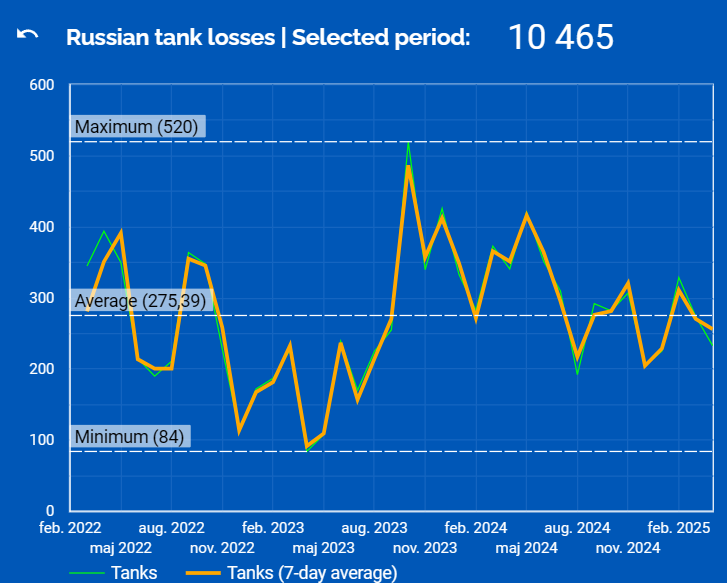
- 3 Tanks
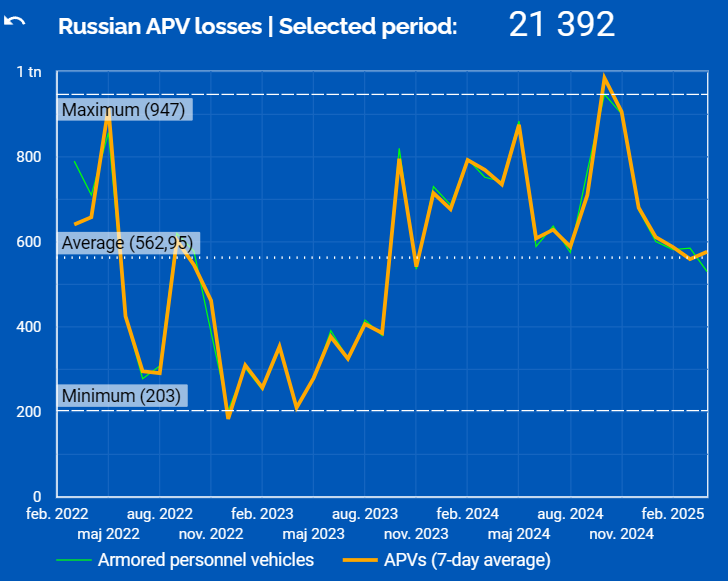
- 5 APVs
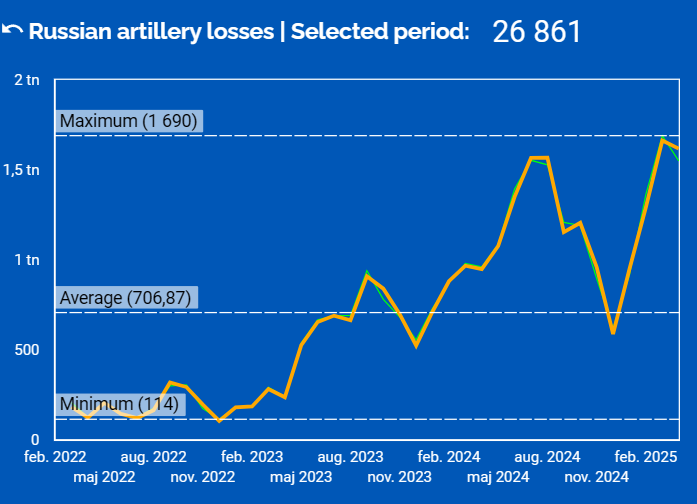
- 61 Artillery systems
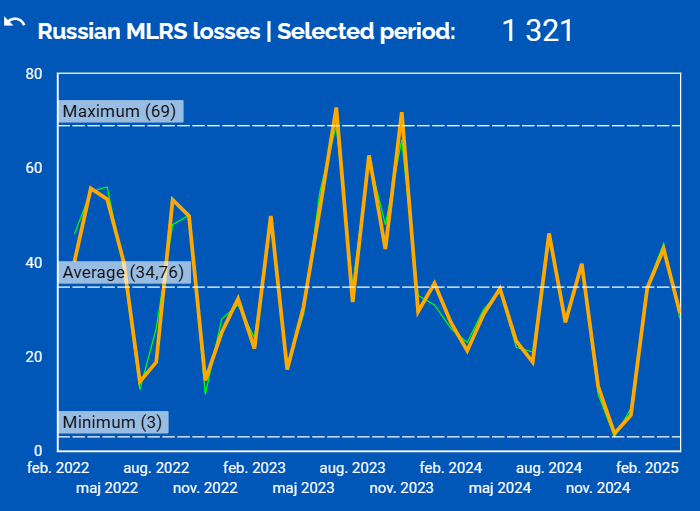
- 1 MLRS
- 145 UAVs
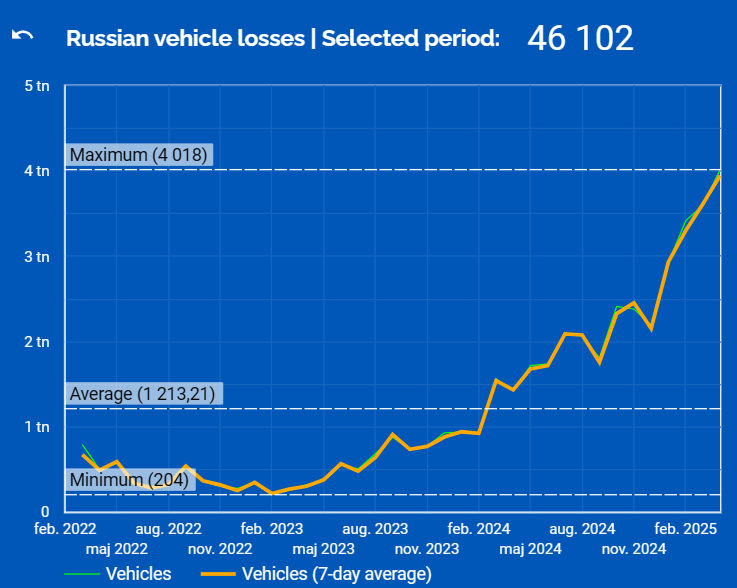
- 103 Vehicles & Fuel tanks
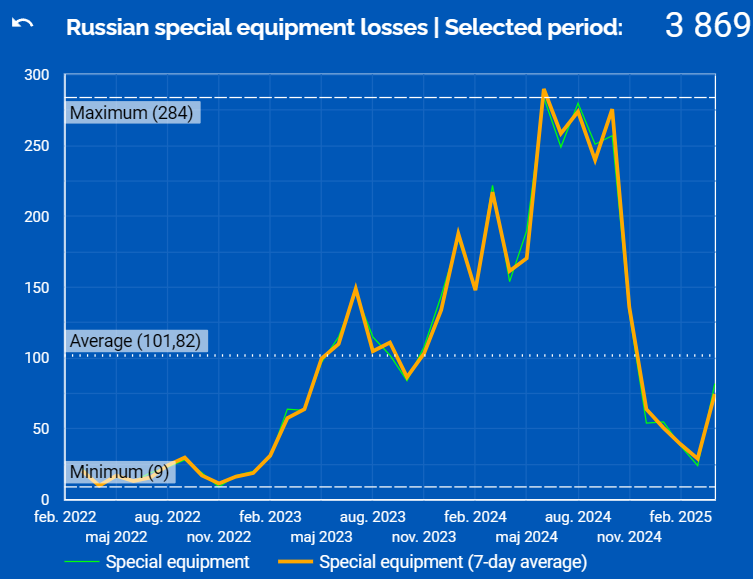
- 3 Special equipment
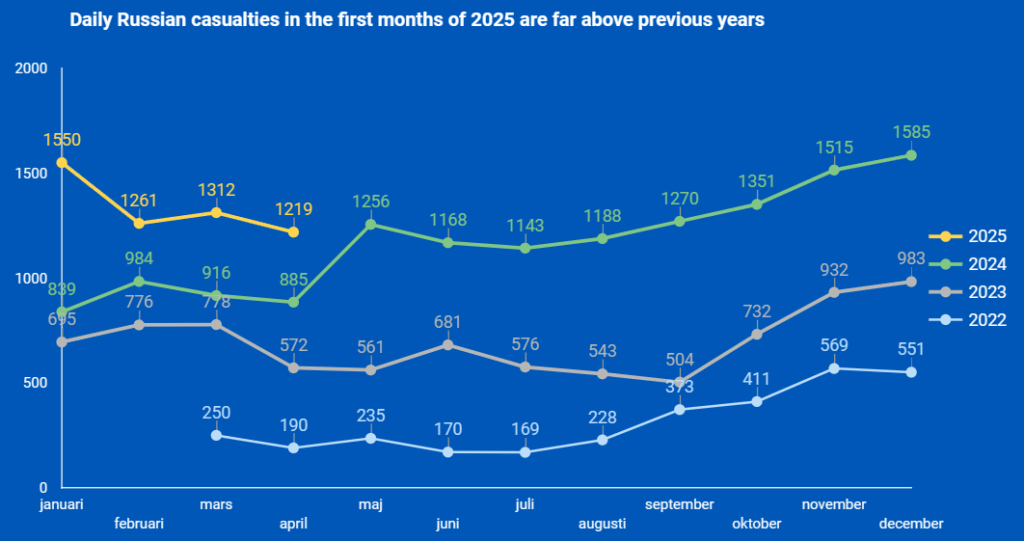
Statistics, month by month up to the end of April
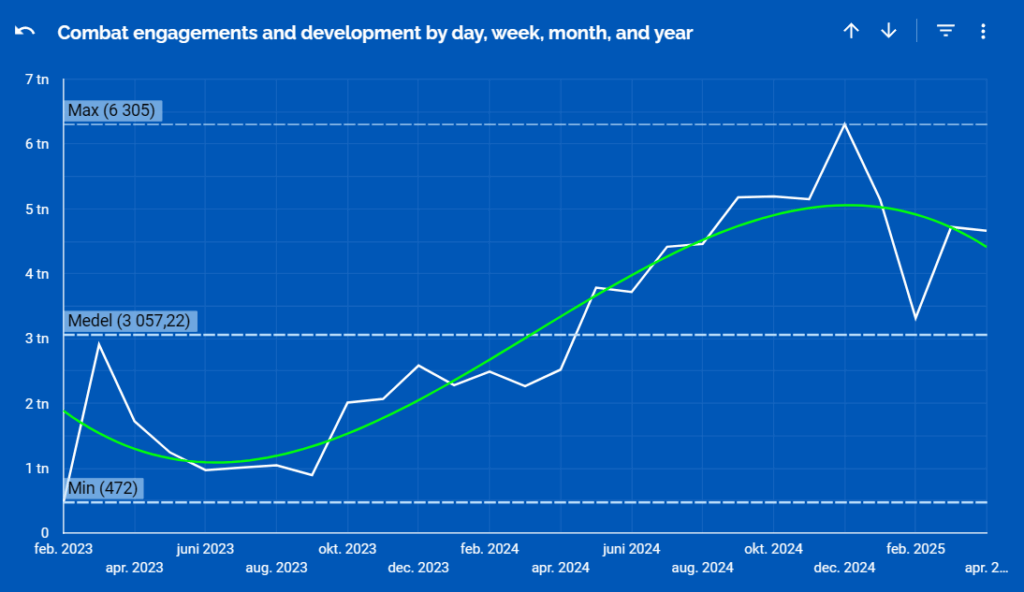
The chart below shows the average of Russian losses in personnel (KWIA) per day, for each month. Although there has been a decrease at the beginning of the year, the losses are significantly higher for January to April compared to the same months last year. In recent days, we have also seen an increase both in the number of KWIA and in the number of conflicts. Last year, there was a sharp increase between April and May, and it is possible that we will see a similar increase this year. In 2023, however, there was a decrease after Russia managed to take Bakhmut. Wagner partly left the front after that, but it is also possible that Russia chose a more defensive approach as Ukraine launched its campaign #SpringIsComing. An offensive that did not start until later in the summer.
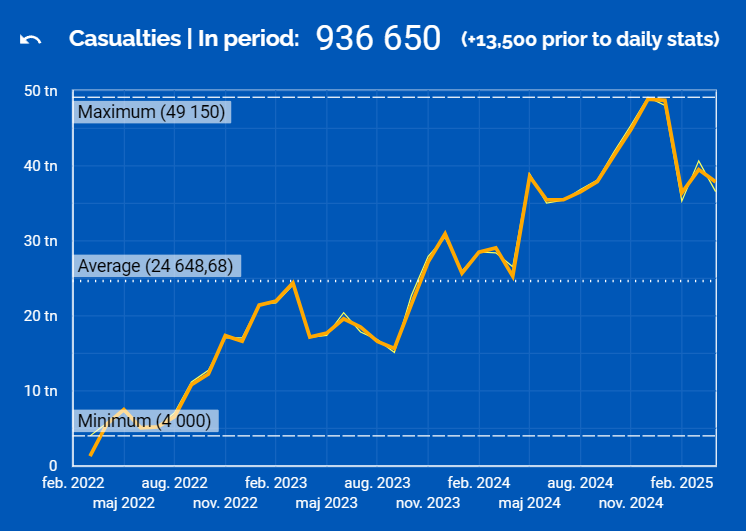
Here, KWIA is shown month by month for the entire period. Here, it becomes even clearer that the losses decreased between February and April.
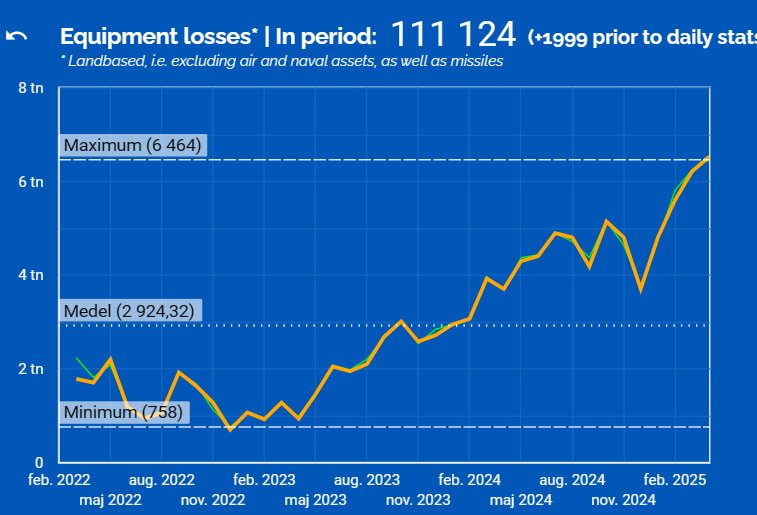
Loss of land-based equipment, including tanks, artillery, etc. Note a sharp decrease in December, but otherwise, it is increasing (and as we will see later, this is mainly due to artillery and soft vehicles (i.e., non-armored vehicles).
Artillery losses were high during the autumn and suddenly dropped significantly in December but have since increased again. March was a record month, but April is almost as high.
Regarding MLRS losses, they are low enough that the variations could be due to chance, but here too, we see a low point in December, just like for artillery. It’s probably not entirely random.
Tank losses vary significantly, but the long-term trend is clear. Since the Russians launched their offensive in October 2023, it has steadily decreased. Low points in August, December, and January.
When it comes to other armored vehicles, it seems that the Russians have more of them, or at least have chosen to use them more frequently, but here too, the trend is downward. However, this trend started in October 2024, unlike the tanks whose downward trend started a year earlier. December was the first month with significantly fewer losses.
When it comes to soft vehicles or other vehicles, including everything from trucks and tankers to buses, cars, motorcycles, etc., the upward trend is clear. Losses are steadily increasing. One guess is that earlier in the war, the losses mainly involved vehicles used for logistics, but later we have seen the Russians attacking with everything they can get their hands on, and a large part of the losses probably come from motorcycles and simpler buses judging by the FPV videos released on social media.
Special equipment has decreased significantly, although there has been a slight recovery in March and April. It’s hard to know why. Perhaps the Russians no longer have as much equipment, or they simply do not dare to place the equipment as close to the front lines.
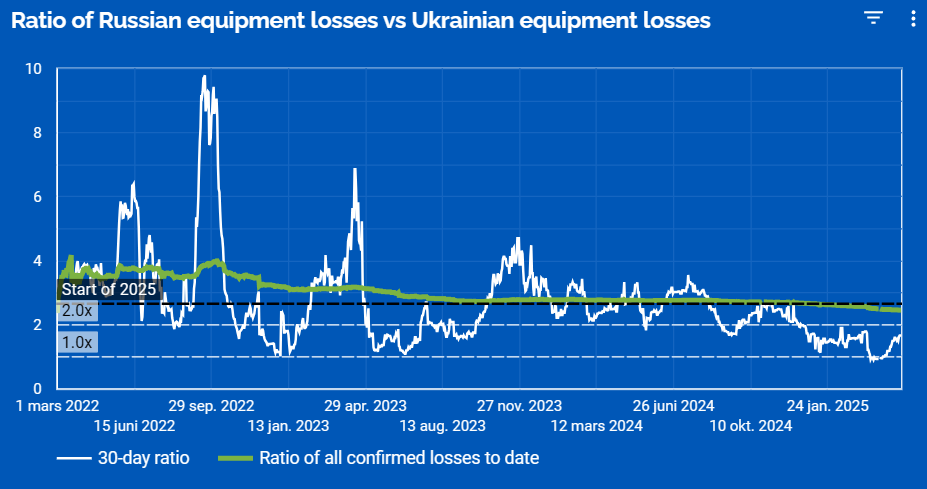
Here we see the ratio between Russian and Ukrainian losses. It looked quite bleak at the beginning of April but has improved towards the end of the month and is now at about 1:1.7. The table is based on Oryx, visually confirmed data. There may be various sources of error in the data, but regardless, the trends that can be observed are likely correct.
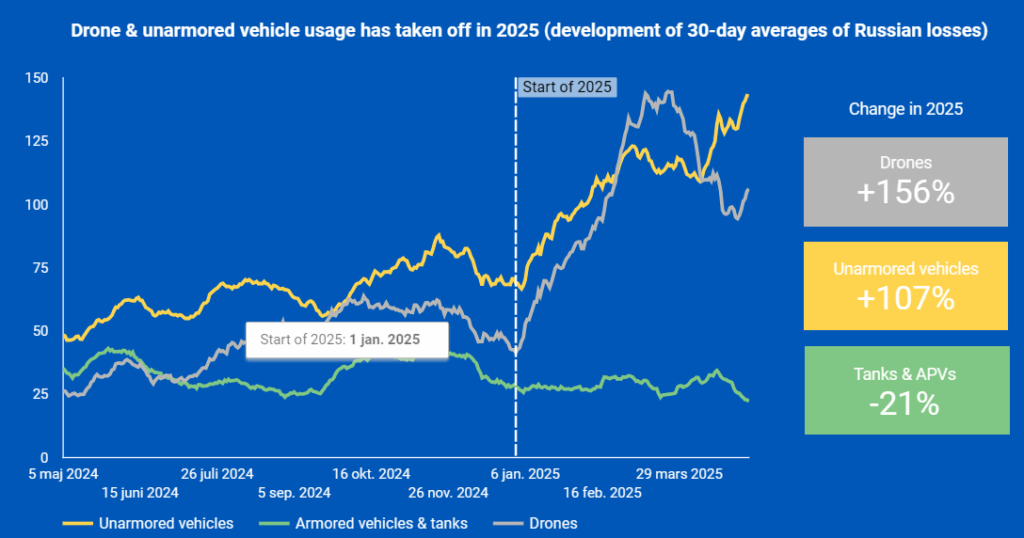
Here we see how the use of regular “soft” vehicles, armored vehicles, and drones has evolved over the past year. Since the beginning of the year, there has been a significant increase in drones and soft vehicles.
In this graph, you can see how the number of conflicts has developed up to April. Note that the peak was reached in December. As you have seen above, December was a month with record-high soldier losses (KWIA), while also being a month with few losses of most other hardware such as artillery, tanks, soft vehicles, etc. There were intense battles in December, but apparently with very poor support. The question is whether this was intentional on the part of the Russians, or if they simply had significant difficulties in getting equipment to the front lines?
Once again, a big thank you to Ragnar who is behind all the statistics! https://bsky.app/profile/did:plc:652zz7suzqeon4lpiftxb6kq
I also want to take this opportunity to thank those of you who have chosen to donate to Johan No.1, it is greatly appreciated and provides energy to continue creating content and developing the website. THANK YOU!
Don't forget to donate, Ukraine's cause is ours! Support Ukraine!
Apologies for the slightly later publication today! It took some time to organize the statistics.
A small mistake on my part, Johan said earlier that he wouldn’t post anything today, so I didn’t even think to check if he had a post in progress. It’s probably best that the usual Ukraine discussions and news are kept in that thread: https://johanno1.se/sv/2025/05/ukraine-daily-update-6th-may-2025
Or we can continue here! 🙂
Decreasing overall, but still high, decreasing (but high) in several of the latest leading sectors in terms of attack rates, while increasing (but not very high) in two of the southern sectors (Hulyapol, Orikivsk). And increasing in Lyman. KWIA/Attack ratio is likely to be higher as personnel losses rose while attacks decreased. If that is the case.
Update from 08:00 06.05.2025 on the Russian invasion
A total of 200↘️ combat actions were registered in the past 24 hours.
⏱️269, 253, 216, 199, 199, 177, 178, 168, 174, 156, 175, 168, 144, 165, 96, 127, 162, 143, 125, 111, 99
#Kharkiv 4
⏱️5, 5, 6, 8, 2, 2, 9, 6, 0, 0, 0, 4, 4, 0, 1, 2, 7, 1
#Kupyansk 5
⏱️7, 6, 6, 5, 6, 9, 7, 3, 4, 5, 4, 1, 3, 2, 1, 7, 11, 4
#Lyman 31↗️💥💥
⏱️22, 16, 27, 27, 36, 21, 18, 20, 22, 19, 15, 20, 14, 25, 12, 14, 17, 20
#Siverskyi 0↘️
⏱️3, 3, 1, 4, 2, 4, 6, 2, 3, 5, 8, 12, 3, 2, 3, 2, 2, 2
#Kramatorsk 4↘️
⏱️10, 6, 8, 6, 6, 13, 10, 16, 13, 8, 13, 1, 6, 4, 5, 7, 6, 8
#Toretsk 6↘️
⏱️16, 7, 8, 4, 10, 6, 14, 9, 29, 16, 17, 13, 23, 10, 18, 26, 11
#Pokrovsk 78↘️💥💥💥💥
⏱️115, 78, 113, 83, 64, 85, 75, 59, 64, 68, 44, 65, 56, 53, 61, 39, 54, 64
#Novopavlivka 24↘️💥
⏱️52, 66, 23, 15, 16, 13, 23, 13, 13, 19, 10, 15, 17, 19, 5, 12, 9, 9
#Huliaipil 7↗️
⏱️5, 0, 6, 0, 0, 0, 0, 0, 0, 0, 0, 0, 0, 0, 0, 0, 0, 0
#Orikhivsk 14↗️💥
⏱️3, 3, 5, 4, 5, 0, 5, 1, 4, 4, 9, 3, 5, 3, 4, 3, 3, 1
#Prydniprovsky 0
⏱️0, 1, 0, 1, 1, 1, 5, 1, 1 , 1, 3, 1, 0, 2, 0, 0, 0
#Kursk 18💥↘️
⏱️23, 23, 20, 33, 21, 25, 15, 23, 15, 30, 27, 26, 22, 21, 16, 20, 23, 21
Yesterday, Ukrainian air force, missile troops, and artillery struck 24 areas where enemy personnel, weapons, and military equipment were concentrated, two command posts, five missile troops and artillery installations, two air defense installations, and four other important enemy targets.
Thank you! 👍
Slightly less activity in number but since the losses were higher, there may have been more people involved.
Japp
Perhaps the same size of group/platoon but less trained soldiers (a long-term trend though) or better equipped Ukrainian defense? Regardless of the explanation, it should be something we will see more of. Otherwise, is it just a variation?
It will be interesting to see if it continues.
“The 🇺🇦Ukrainian Defense Forces managed to stabilize the situation in the Pokrovsky direction and in some places seize the tactical initiative, — Commander-in-Chief of the Armed Forces of Ukraine Syrsky”
https://bsky.app/profile/militarynewsua.bsky.social/post/3loicefjfkk2b
“Polish President Duda said he is pressing Donald Trump to ramp up sanctions on Russia to force an end to the war, – Politico 🗣️Duda: “America can use various economic instruments to force Russia to respect certain actions. So if anyone is in a position to force Putin to make peace, it is Trump.”
https://bsky.app/profile/maks23.bsky.social/post/3loicc6mabk2x“
“Eighty years after the second world war, polling shows many Americans and western Europeans believe an even more devastating third global conflict could break out within a decade, with tensions with Russia seen as the most probable cause, – The Guardian”
https://bsky.app/profile/maks23.bsky.social/post/3loic2i6v7s2x
Very high crew, high rear and lower APC.
“Serdobsk, Penza region. Unmanned Systems Forces carried out an attack on the missile and artillery weapons arsenal (military unit 58661-90)”
https://bsky.app/profile/maks23.bsky.social/post/3loibvryuas2x
“Drones attacked the 🇷🇺Moscow region at night. Explosions were also heard in Lipetsk, Penza and Voronezh regions. The “interception” plan was implemented at Moscow’s Vnukovo, Sheremetyevo, Zhukovsky, Domodedovo airports and at the airports of Saratov, Ivanovo, Nizhny Novgorod, Yaroslavl, Samara, Volgograd, Kaluga, Kazan and Nizhny Kamsk. In total, the Russians claim to have shot down 105 UAVs in 11 regions.”
https://bsky.app/profile/militarynewsua.bsky.social/post/3loibr4ljd22b
Russia launched a massive drone strike on Kharkiv. The attack resulted in 6 fires, 4 people suffered acute stress reactions. ❗️90 shops were damaged and 20 were completely burned down at the Barabashovo market.”
https://bsky.app/profile/theukrainianreview.bsky.social/post/3loibgq35522x
Raiffeisenbank from Austria would have avoided this if they had left Russia.
“The Central Bank has seized from Raiffeisenbank the equivalent of the amount lost in court in the amount of 1.9 billion euros. The equivalent of 1.87 billion euros in rubles has been seized by the Central Bank of Russia and transferred to the accounts of Rasperia.”
https://bsky.app/profile/evgen-istrebin.bsky.social/post/3loiaugdo4k2k
https://frankmedia.ru/200739?utm_source=tf
Crude Oil has unfortunately recovered somewhat and is currently at 58.35 (+2.11%)
Trump has become very sour towards Harvard.
“US President Donald Trump is freezing all federal research grants and all other federal aid to Harvard University, according to American media.
The federal grants and aids amount to around 8 billion dollars, equivalent to 80 billion Swedish kronor. Previously, the White House announced that 2 billion dollars will be frozen.”
https://omni.se/trump-fryser-allt-stod-till-harvard-tills-krav-uppfylls/a/4BeEBe
80 billion distributed among 20 thousand students is approximately 4 million per student.
Comparing it to Lund University, which has a budget of 10.8 billion and 30,000 students, it is 0.36 million.
So, it costs 10 times more to conduct education at Harvard than at Lund. Both are theoretical universities, so it is not an expensive education because of that.
Amazing numbers!
I wonder how the research looks, if it can possibly explain some of the huge difference?
Trump wants to benefit the domestic film industry and he has gotten stuck in the idea that tariffs are the answer to everything so he wants 100% tariffs on films, but no one seems to really understand how it is supposed to work.
“Donald Trump’s latest tariff statement aimed at foreign films is making the industry scratch their heads. This is reported by Bloomberg and the Wall Street Journal.
– Does he mean that films produced in New Zealand cannot be released in the USA without a 100% tariff? Or does he mean that American-produced films shot here or in other locations are in the crosshairs? Either way, it would be terribly unfortunate, says Irene Gardine from the organization Spada.”
https://omni.se/trumps-filmtullar-forbryllar-det-vore-fruktansvart-synd/a/EyMx7j
✊🏻✊🏻✊🏻🤡!
Bolton and I agree on Witkoff! 😂
“Donald Trump’s former national security adviser John Bolton criticizes the president’s choice of Steve Witkoff as ambassador to Ukraine. In an interview with CNN, Bolton, who was fired in 2019 and is now a vocal critic of Trump, says it is hard to imagine a less suitable person for the job.”
https://omni.se/trumps-sandebud-sagas-vet-inget-om-forhandling/a/PpxgnJ
Iofs helt rätt val ur ett kakistokrati-perspektiv👍🏻.
In a way, a completely correct choice from a kakistocracy perspective👍🏻.
An experiment similar to the USA’s invasion of Iraq in 2003 is taking shape in Gaza. This is written by Haaretz’s Amir Tibon in an analysis.
What Tibon is referring to is Israel’s new plan for a “conquest” of Gaza. There is no clear idea in it of what an end to the war will look like.
🤬
“Storages with children’s toys, school supplies and clothes were the targets of Russian terrorists in Kharkiv. Russia will probably say all of NATO was in there.”
https://bsky.app/profile/antongerashchenko.bsky.social/post/3loidulahac2s
The customs are likely high on the agenda!
“Canadian Prime Minister Mark Carney has arrived in Washington to meet with 🇺🇸US President Donald Trump”
https://bsky.app/profile/militarynewsua.bsky.social/post/3loidsrv5qk2b
“Kharkiv, Barabashovo market….”
https://bsky.app/profile/maks23.bsky.social/post/3loidq7o3fs2c
“The 🇺🇦Ukrainian Defense Forces managed to stabilize the situation in the Pokrovsky direction and in some places seize the tactical initiative, — Commander-in-Chief of the Armed Forces of Ukraine Syrsky”
https://bsky.app/profile/militarynewsua.bsky.social/post/3loicefjfkk2b
Impressive during an onslaught where the number of attacks in the sector in recent days has been over 100. May have to do with the knocked out command center a few days ago, reported by AFU. The post the other day (mxt: can the post be linked to?):
205
2025-05-04 at 09:07:24
It has been hit!
It has been confirmed that the air force of the Ukrainian armed forces recently carried out a devastating attack on the enemy’s 6th motorized rifle division command post near Bakhmut, a temporarily occupied area in the Donetsk region.
As a result of the attack, the ability of the Russian Federation’s occupation forces to control the Pokrovske direction was significantly reduced. Information on enemy losses is currently being updated.
Ukrainian defense forces continue to deter the enemy’s offensive and inflict significant losses on the enemy.
General Staff 🇺🇦
Answered it myself! The link goes directly to the post…
MSN writes about the results from a NATO exercise. I hardly see MSN as a very serious news provider. Still, one can’t help but feel a little proud:
“The CV90 crew took first place and the tank group placed third in the sharp competition, …”
https://www.msn.com/sv-se/nyheter/other/svenska-soldater-chockade-nato-kammade-hem-vinst-i-skarp-t%C3%A4vling/ar-AA1Ec8fY
Beautiful! 👍
Press release from the Swedish Armed Forces.
https://www.forsvarsmakten.se/en/news/2025/05/sweden-shined-in-the-nato-exercise-iron-spear-in-latvia/
👍
Nice 🌟! The ending makes me think of an interview with an American tank commander from Desert Storm. He was asked how the technical difference between the tanks affected the outcome. He answered something like that what decided the battle was the crews. The Americans were much better trained than their Iraqi opponents, and he believed that his unit would have won even if they had been driving the Iraqi tanks – such was the difference in tactical performance.
“A tank of the NGU “Lyut” goes out to practice on Russian soldiers hiding in high-rise buildings.”
https://bsky.app/profile/maks23.bsky.social/post/3loijidkggc22
He doesn’t seem to realize that Trump’s peace plan isn’t really going so well.
“We will promote peace”: The pro-Russian winner of the first round of the Romanian presidential elections made a statement about the war. George Simion emphasized the need to achieve a ceasefire, in line with the wishes of the current U.S. President Donald Trump’s administration.”
https://bsky.app/profile/wartranslated.bsky.social/post/3loijgch6ec2g
He hasn’t quite realized that Trump’s love for Putin is not reciprocated.
Putin’s power is partly based on having a strong external enemy, i.e. the USA or China.
Russia is significantly more dependent on its long-term cooperation with China than on a USA with a president who can change his mind several times in one sentence.
I also don’t understand what he thinks Romania would gain by supporting Putin if he doesn’t feel confident that Ukraine will be completely defeated, of course.
Probably he doesn’t care about Romania at all but has an account filled with rubles somewhere.
Well, here we are again.
“Poles will block the border with Ukraine, a protest is planned at the Dorohusk-Yagodzin border crossing point, — KZPR in the field of transport in Poland ❗️The reason is the cancellation of permits for Ukrainian carriers.”
https://bsky.app/profile/maks23.bsky.social/post/3loij3u457s22
It’s been a while since anyone saw anything from there. Could it be preparatory cleanup?
“FPV drone of Ukraine’s Navy drone unit destroyed a Russian D-30 122mm howitzer being towed by a Ural truck on the Kinburn Spit.”
https://bsky.app/profile/maks23.bsky.social/post/3loihkhctq22z
“Putin Doesn’t Want Peace, He Wants Ukraine,” — Former US VP Mike Pence Putin “only understands force,” so the US should make a clear statement about continuing support for Ukraine, he said. And the Trump administration’s “unstable support” for Ukraine “has only emboldened Russia,” — Pence.”
I wonder if China actually wants to bring the operations back home?
Wouldn’t surprise me if they shut down the entire factory and move production to China despite it being newly built.
“Volvo Cars battery company Novo Energy is downsizing, the company stated in a press release.
The decision means that around half of all employees will disappear at the battery factory in Torslanda in Gothenburg. The decision has been made to save money.”
https://omni.se/volvo-cars-battery-factory-lays-off-half-of-the-staff/a/B0KxRw
Considering that it was a collaboration with Nortvolt, there are probably some of the issues that existed at Nortvolt also at Novo Energy.
Do over, do it right!
Surely can be so as well.
Geely has sufficient capacity in China. They do not need to “bring home” any operations. However, it is important to have battery production close to factories where electric cars are manufactured. So some kind of operation will remain. Batteries are heavy items.
Good point, the transportation costs can certainly eat up a lot of the savings made by bringing production home.
Plus any EU customs duties can be avoided.
Let’s hope for sun, wind, and water this summer!
“The planned restart of the nuclear reactor Oskarshamn 3 is postponed until the end of the summer, reports TT referring to the electricity market Nordpool.
The reactor has been out of operation since March for maintenance, and the restart was planned for mid-June. Now the restart is postponed until August 15, due to the repair of a crack in a pipe.”
https://omni.se/aterstart-av-reaktor-i-oskarshamn-skjuts-upp/a/EyMJno
Do NOT tell Johan 🧐.
😀
WARNING!
“Another example. Today, a 3-man Russian diving group was detected and eliminated by Ukrainian forces on the eastern front.”
https://bsky.app/profile/noelreports.com/post/3loiprcmqfc27
“One of the terrorism suspects who were arrested in the United Kingdom on Sunday has close ties to the regime in Iran, according to information provided to The Telegraph.
In total, five men suspected of planning a terrorist attack against a ‘specific location’ were arrested. Police operations took place in several locations across the country just hours before the attack was supposed to take place.”
Here one becomes a little curious, really didn’t Trump know anything about this, or is this part of an attempt from his side to pivot 360 degrees on the Ukraine issue and throw Hegseth under the bus?
“Exclusive: Order by Hegseth to cancel Ukraine weapons caught White House off guard
Roughly a week after Donald Trump started his second term as president, the U.S. military issued an order to three freight airlines operating out of Dover Air Force Base in Delaware and a U.S. base in the United Arab Emirates: Stop 11 flights loaded with artillery shells and other weaponry and bound for Ukraine.
The verbal order originated from the office of Pete Hegseth, the secretary of defense, according to TRANSCOM records reviewed by Reuters.
The cancellations came after Trump wrapped up a January 30 Oval Office meeting about Ukraine that included Hegseth and other top national security officials, according to three sources familiar with the situation. During the meeting, the idea of stopping Ukraine aid came up, said two people with knowledge of the meeting, but the president issued no instruction to stop aid to Ukraine.”
https://www.reuters.com/world/us/order-by-hegseth-cancel-ukraine-weapons-caught-white-house-off-guard-2025-05-06/
Having a boss who changes opinion several times in one sentence is probably not easy to please, especially since Trump’s subordinates do not realize that their loyalty to Trump is not reciprocated. Trump doesn’t seem to care that his mistreated employees often end up becoming his aides’ enemies, like Bolton.
And then Hegseth doesn’t seem to be the sharpest brain is another matter.
The caterpillar on the move again, sigh.
“Lavrov blamed Europe for supporting “Ukrainian Nazism” and threatening Russia with strategic defeat on the battlefield. This is actually one of the widely discussed topics in Russia these days: they talk about “rising Nazism in Europe,” call Europe “the party of war” that doesn’t want peace.”
https://bsky.app/profile/antongerashchenko.bsky.social/post/3loirhcfoic2
A group of 24 traders bought large holdings in the cryptocurrency melania of President Trump’s wife Melania Trump just before its launch. At the launch, the value of the currency soared, prompting the group of investors to sell their holdings – and make a substantial profit. This is shown in an investigation by the Financial Times. According to the newspaper, the investors both bought and sold the majority of the holdings within twelve hours and made $99.6 million on the move, equivalent to around 963 million Swedish kronor.
https://omni.se/a/bmvXQd
All these currencies feel like pyramid schemes.
Agree, perfect way to get fooled for those who have unnecessary amounts of money.
Of course, I would have gladly bought Bitcoin if I had gotten in early, but in reality, I am completely against currencies that have no underlying value.
“Ukraine will lift the ban on arms exports: there is already approval from Zelensky, — Forbes 👀 Minister of Economy reported that a political decision on the mechanism for opening arms exports could be made as early as May.”
https://bsky.app/profile/maks23.bsky.social/post/3loiswhmzns2c
😂
“Russian air defenses were so heroically “protecting” Moscow from drones last night that one of their own missiles proudly parked itself in the living room of a high-rise apartment in suburban Podolsk.”
https://bsky.app/profile/wartranslated.bsky.social/post/3loiqqfut2s2g
Let’s see how it goes this time.
“A second round in the election of a chancellor in Germany will be held this afternoon, several media outlets report.”
https://omni.se/uppgifter-ny-tysk-omrostning-i-eftermiddag/a/3Mb5p9
“Ukraine’s MFA on foreign troops marching in Moscow on May 9: “To march alongside Russian soldiers is to share responsibility for the blood of murdered Ukrainian children, civilians, and soldiers. We urge all nations, especially those claiming neutrality, to refrain from taking part.”
https://bsky.app/profile/noelreports.com/post/3loiuqjl3wk2l
The NATO summit in The Hague in June will decide to raise the target for defense spending to 3.5 percent. That is what Prime Minister Ulf Kristersson believes, who today met with the parliamentary parties for a security policy meeting.
Kristersson predicts that the decision will result in an increase from 2 percent of GDP to 3-4 percent of GDP.
Smotrich openly dreams of committing ethnic cleansing and genocide. This is starting to sound like the lunatics in Russian media when they want to get rid of all Ukrainians. Is this really in line with the majority of Israel’s population?
“A victory for Israel in Gaza will mean that the strip is ‘completely destroyed,’ says Israel’s finance minister Bezalel Smotrich according to AFP.
– Gaza will be completely destroyed, civilians will be sent south to a humanitarian zone without Hamas or terrorism, and from there they will start leaving in large numbers to third countries, says Smotrich.”
https://omni.se/israeliska-ministern-gaza-kommer-fullstandigt-forstoras/a/qPgvLg
Not everyone in Israel thinks it’s a good idea.
“Israel’s plan to expand the offensive in Gaza and take over the entire strip is causing panic among many Palestinians in the area, writes AP. People have endured 19 months of heavy bombardment and now the possibility of a ceasefire seems to be slipping further away.
– What do you have left to bomb? asks Moaz Kahlout, who has been forced to flee his home in Gaza City.
Some Israelis also oppose Israel’s plan and on Monday hundreds demonstrated outside the parliament.”
https://omni.se/israels-plan-skapar-panik-pa-bada-sidor-vad-har-ni-kvar-att-bomba/a/B0KGeg
“Another 205 of our defenders have returned to Ukraine. On May 6, a prisoner exchange took place between the Ukrainian and Russian sides.”
https://bsky.app/profile/wartranslated.bsky.social/post/3loiwjfiyac2g
“I can’t imagine shooting at people I once fought shoulder to shoulder with. But that’s exactly what Russians are doing now.” writes a 98-year-old WWII veteran from Kyiv.”
“Ukrainian drones spotted over Russia’s Oryol region.”
https://bsky.app/profile/noelreports.com/post/3loizrvrqek2l
“Lithuania is considering launching the production of naval drones under the “1+1” scheme — one for itself, one for Ukraine. The country is interested in Magura drones, – Militarnyi 🚤Lithuanian MoD is interested in Ukrainian surface drones, missile drones and other weapons.”
Actually nothing that any conclusions can be drawn from. Then one can wonder, will it be the opposite later, is it really proof that things are going well?
– We have a trade surplus, yay, although it is of course a bit sad that prices have risen by 25-75% and that there is a shortage of both this and that…
“The US trade deficit surged to a new record level in March, as importers rushed to fill up inventories ahead of expected tariffs, writes WSJ.
The deficit increased by 14 percent on a monthly basis from February to March, to a new record level of 140.5 billion dollars. This is the opposite effect of what Donald Trump is trying to achieve with his trade policy, the newspaper continues.”
46.7% now prefer Imamoglu compared to 39.3% for Erdogan.
“Istanbul’s mayor Ekrem Imamoglu is becoming increasingly popular among Turkish voters, reports Reuters. Imamoglu, seen as President Recep Tayyip Erdogan’s main challenger, was arrested and imprisoned in March. Since then, support for him has increased, according to two recent polls.”
https://omni.se/turkarnas-stod-for-fangslad-utmanare-starks/a/kwr84Q
“According to Russian channels, Ukrainian forces control a small part of southwestern Tetkino on the Kursk border, active fighting is also reported near Novyi Put and Volfino.”
“😎💥Destruction of Russian BUK-M2 air defense system, 2S19 Msta-S howitzer and other equipment in the Kursk region by 413th Unmanned Systems Battalion.”
https://bsky.app/profile/maks23.bsky.social/post/3lojgqqhyhc2u
“❗️Spectacular destruction of the 🇷🇺Russian 152-mm self-propelled howitzer “Msta-S” as a result of strikes by 🇩🇪German HF-1 kamikaze drones in the eastern direction”
https://bsky.app/profile/militarynewsua.bsky.social/post/3lojfs5bgfk2t
After Lithuania, Latvia has also denied overflight permission for the Serbian plane carrying President Vučić to Moscow — citing “political sensitivity.” This comes ahead of his planned May 9 meeting with Putin, as more EU states block travel linked to Russia’s Victory Day events.
https://bsky.app/profile/noelreports.com/post/3lojgxr5soc2r
A bit funny, let’s hope that Poland joins in so that he is forced to take a detour 😅
Now Poland is joining 🥳
UPDATE: 🇱🇻Latvia, 🇱🇹Lithuania and 🇵🇱Poland have banned flights through their airspace to planes carrying Serbian President Vučić and Slovak Prime Minister Fico, who were heading to Russia for the May 9 celebrations.
✊🏻🌟!
👍
💔🤬
“⚡️Update: Russian missile strike on Sumy suburb kills 3, injures 7
The death toll of a Russian attack on a suburb of Sumy has risen to 3, as a 6-year-old boy and a 41-year-old man died on the way to the hospital, the Sumy Oblast Military Administration reported.”
https://bsky.app/profile/kyivindependent.com/post/3lojfth4a722e
“💥 Destruction of Russian Pantsyr-S1, radar and Kasta in Crimea!”
https://bsky.app/profile/maks23.bsky.social/post/3lojfrkidzk2t
“❗️🇷🇺UralVagonZavod reports on sending new batches of T-72B3 and T-90M tanks to the front”
https://bsky.app/profile/militarynewsua.bsky.social/post/3lojfj7njtk2t
According to Russian channels: 5 Neptune anti-ship missiles bypassing Crimea, flying south of Sevastopol to the east.
https://bsky.app/profile/noelreports.com/post/3lojk3x5sz22r
👍
🇮🇳Indian Army: “Indian Armed Forces launched “Operation Sindoor” hitting terrorist infrastructure in Pakistan and Pakistani Kashmir.
India carried out precision strikes at terrorist camps. No Pakistani military facilities have been targeted.”
Nine sites have been targeted as part of Operation Sindoor
https://bsky.app/profile/maks23.bsky.social/post/3lojpp3l46c2m
Lite missiler över gränsen mellan Indien och Paki.
“⚡️Media report explosions along the India-Pakistan border. India launched strikes on several targets.
I cannot confirm whether this video is authentic.”
https://bsky.app/profile/antongerashchenko.bsky.social/post/3lojqk2vqvs2k
“India launched Operation Sindoor, striking nine targets it identifies as terrorist infrastructure in Pakistan and Pakistani-administered Kashmir. According to the Indian military, the precision strikes avoided Pakistani army facilities. One missile was aimed at an old airport in Muzaffarabad.”
“🇵🇰✈️❌ Pakistan stänger sitt luftrum i 48 timmar.
❗️Missilerna från Indien riktade in sig på Masji-e-Subhan-moskén i Bahawalpur, Punjab-provinsen. Ett barn dödades och en kvinna skadades.”
https://bsky.app/profile/maks23.bsky.social/post/3lojqeuj66s2m
“🤯🇵🇰 The moment of strike in Pakistan!”
https://bsky.app/profile/maks23.bsky.social/post/3lojq6uml622m
In Moscow, hysteria seems to be growing ahead of Putin’s hyped-up celebration of Victory Day on May 9. The internet has largely been shut down, which, among other things, is affecting ATMs. Russians are now almost neurotically nervous that Ukraine will actually strike Moscow this Friday.
https://bsky.app/profile/friaukraina.bsky.social/post/3lojou2tkw227
Ivan can’t withdraw money to buy his daily ration of Vodka.
😄👍
“Moscow region 💥💥💥💥”
https://bsky.app/profile/maks23.bsky.social/post/3lojopdgc3k2m
“❗️🇺🇦Ukrainian UAVs flying over Ramenskoye, 🇷🇺Moscow Oblast.”
https://bsky.app/profile/militarynewsua.bsky.social/post/3lojokx3qt22l
“Explosions in Shchyolkovo, Moscow Oblast.”
“‼️ Russia: “Sukhoi Superjet 100 aircraft of Rossiya Airlines, flying from Blagoveshchensk to Yuzhno-Sakhalinsk, made an emergency landing at the destination airport”
Due to “technical malfunction of the aircraft”
🚨 DO NOT FLY ON A RUSSIAN AIRLINE”
Did you see the drone cloud over the northern front yesterday?
You may not have seen it because the sky was obscured – Putin is probably absolutely terrified right now for his parade.
He is currently sitting with a pile shiver!
“On russian Telegram: Moscow skies shot down, Ukrainian’s are successfully poking the bear tonight.
Departures and landings at Vnukovo and Domodedovo have been temporarily suspended
Rosaviatsiya has closed airports due to drone attacks. Planes are circling in the sky, waiting for permission to land”
India has bombarded Pakistan with rockets 😳
I see that Wesley is very fast above